Author: LBank Research Analyst: Ludo
Disclaimer: This report is compiled and analyzed from publicly available information and is intended solely for information sharing and research discussion. It does not constitute investment advice, a securities recommendation, a trading instruction, or any guarantee of returns. The company operations, valuations, market prices, and consensus expectations discussed herein may change over time. Readers should independently verify the data and make their own decisions.
1. Core Conclusion
Overall judgment: Pfizer is a credible pharmaceutical franchise undergoing an uneven earnings transition. At 10.5x guided adjusted earnings, valuation is reasonable to modestly inexpensive, with a cautiously positive long-term bias; weak cash dividend coverage limits the margin of safety. The decisive variable is replacement-product cash generation after mature-product erosion.
-
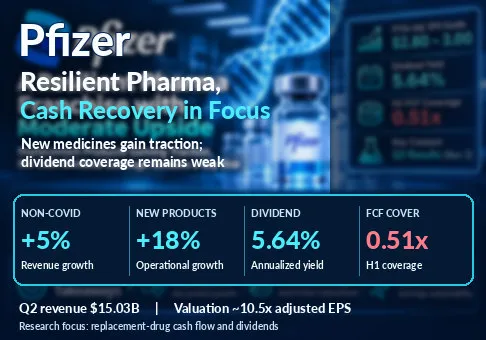
The price recognizes stagnation, but not necessarily another earnings reset. We use the confirmed October 30 underlying equity close of USD 30.52 because November 2 public snapshots are inconsistent and include intraday observations. Dividing by the August full-year adjusted EPS guidance of USD 2.80–3.00 gives 10.2–10.9x, or 10.5x at USD 2.90. The annualized USD 0.43 quarterly dividend implies 5.64%. These are equity metrics; neither dividend entitlement nor the stock quote is inferred from PFEON.
-
Commercial replacement is progressing faster than consolidated growth suggests. Q2 non-COVID operational revenue grew 5%, versus 1% for the group, and launched/acquired products grew 18%. The difference supports a recovery thesis, although selected launch growth cannot be applied to the entire revenue base. The investment case rests on these products becoming large enough to outweigh declining franchises.
-
Earnings quality remains mixed. Q2 adjusted EPS was USD 0.77 while reported loss per share was USD 0.04, reflecting substantial intangible impairments. Adjustments help assess current operations, but past acquisition spending still represents shareholder capital. A low adjusted multiple alone does not prove that the company earns attractive returns on that capital.
-
The dividend requires a seasonal cash recovery. H1 FCF was USD 2.481 billion against USD 4.896 billion of cash dividends, a 0.51x coverage ratio. Improved cash generation is real, but the payout was not internally covered during that period. This supports an income thesis only if subsequent cash collection closes the gap without renewed balance-sheet pressure.
-
The next catalyst can improve the evidence, rather than guarantee a rerating. Q3 results are scheduled for November 3 before the U.S. market opens, with a 10:00 a.m. EST call, equivalent to 23:00 Beijing time. October 27 ELREXFIO Phase 3 progress improves pipeline credibility. It is not yet proof of incremental approved-label revenue or a durable earnings inflection.
Our illustrative valuation framework uses sustainable adjusted EPS and a deliberately modest multiple. A base USD 2.90 at 11x implies USD 31.90; a bear USD 2.50 at 9x implies USD 22.50; a bull USD 3.20 at 13x implies USD 41.60. Against USD 30.52, these represent approximately +4.5%, −26.3% and +36.3%, excluding dividends. These are analyst assumptions, not management forecasts, consensus targets or probability-weighted fair values. The base case offers limited immediate rerating; stronger upside requires evidence that earnings and cash can grow together.
The user requested a pharmaceutical name within LBank's range. PFEON was selected after opening its populated official spot interface and confirming Pfizer mapping in the listing announcement. Previously screened AMDON, AAPLON and COSTON supplied the broader verified candidate pool; sector relevance takes priority in the final choice. No Pfizer coverage was found in the project tracker. Cached trading-page numbers are excluded from valuation and are not represented as live quotes.
2. Company Overview, Business Mix, and Core Operating Metrics
Pfizer discovers, develops, manufactures and markets medicines and vaccines. Customers include wholesalers, hospitals, pharmacies and public purchasers; economic demand ultimately depends on prescribing physicians, patients and payer reimbursement. Revenue combines direct product sales, alliance revenue, royalties and manufacturing services. Revenue recorded by Pfizer is therefore not automatically equivalent to a product's worldwide end-market sales.
Biopharma is the dominant reportable segment. The commercial portfolios below describe its mix rather than five independently reported profit segments. Primary Care contains large recurring prescriptions alongside seasonal vaccines and volatile COVID demand. Oncology depends on indication expansion, treatment-line adoption and combination regimens. Specialty Care depends on diagnosis and reimbursement for complex diseases. Hospital and Biosimilars competes more directly on supply reliability and price. CentreOne provides manufacturing services with different economics from patent-protected medicines.
|
Portfolio / business
|
Q2 2026 revenue, USD million
|
Economic driver
|
|
Primary Care
|
5,503
|
Eliquis, Prevnar, COVID products; prescription volume, net price and vaccine seasonality
|
|
Oncology
|
4,165
|
Ibrance, Padcev, Xtandi and newer launches; treatment-line penetration and alliance economics
|
|
Specialty Care
|
3,353
|
Vyndaqel family and immunology; diagnosis, access and net reimbursement
|
|
Hospital and Biosimilars
|
1,640
|
Residual calculated as Biopharma less the three portfolios above; hospital supply and pricing
|
|
Pfizer CentreOne
|
373
|
Contract manufacturing and active pharmaceutical ingredients
|
Core operating metrics and changes
|
Operating indicator
|
Q2 2025
|
Q2 2026
|
|
Revenue, USD million
|
14,653
|
15,034
|
|
Operational growth excluding COVID
|
—
|
5%
|
|
Launched and acquired products operational growth
|
—
|
18%
|
|
Reported EPS, USD
|
0.51
|
(0.04)
|
|
Adjusted diluted EPS, USD
|
0.78
|
0.77
|
|
Reported cost of sales / revenue
|
25.8%
|
27.2%
|
|
Reported R&D, USD million
|
2,482
|
2,809
|
The most useful distinction is between demand growth, price realization and foreign exchange. A reported increase can coexist with weak underlying demand, while better access can increase patient volume but lower net price. Launches also require spending before peak sales, so growing revenue need not produce immediate EPS growth. Product concentration and reimbursement economics matter more than the number of launches announced.
The Q3 setup has a clear benchmark. MarketBeat's retrieved November 2/3 snapshot shows approximately USD 15.85 billion revenue and USD 0.729 adjusted EPS; Zacks' October 28 snapshot shows USD 16.13 billion and USD 0.72. Both are secondary consensus sources, and their different dates and contributor sets prevent treating either as a single definitive market expectation. We use them as a USD 15.85–16.13 billion revenue reference band, not company guidance. No verified options-implied move or proprietary buy-side expectation is used.
For the quarter, our base scenario is revenue around USD 16.0 billion and adjusted EPS around USD 0.73, with the existing annual range maintained. A bull outcome requires revenue above USD 16.13 billion plus convincing replacement-product growth and stronger annual cash visibility. A bear outcome combines revenue below USD 15.85 billion with weakened forward guidance or slower cash collection. An isolated EPS beat caused by timing or one-off income would not meet the bull condition. The likely share-price direction is positive, neutral or negative respectively, but we do not assign unsupported event-return percentages.
The ELREXFIO announcement deserves attention because a successful comparative Phase 3 trial can support movement into a broader treatment setting. The company reported a PFS benefit in MagnetisMM-32 and plans regulatory submissions; overall survival remains immature. Commercial value must pass further gates: detailed data, regulatory review, label scope, reimbursement, clinician adoption and manufacturing readiness. Assigning peak sales immediately would collapse these distinct risks into an unjustified certainty.
3. Fundamental Quality
|
Financial quality
|
H1 2025
|
H1 2026
|
|
Revenue, USD million
|
28,367
|
29,484
|
|
Reported net income, USD million
|
5,877
|
2,440
|
|
Adjusted income, USD million
|
9,671
|
8,730
|
|
Adjusted diluted EPS, USD
|
1.69
|
1.52
|
|
Operating cash flow, USD million
|
1,753
|
3,450
|
|
Capital expenditure, USD million
|
1,182
|
969
|
|
FCF: operating cash flow less capex, USD million
|
571
|
2,481
|
|
Cash dividends paid, USD million
|
4,882
|
4,896
|
FCF here is our transparent calculation of operating cash flow less purchases of property, plant and equipment. It excludes acquisitions and other investing cash flows; it is not cash remaining after every growth commitment. H1 comparisons use the same six-month period, avoiding the error of comparing a quarterly EPS figure with a half-year cash number. Cash conversion improved, yet adjusted income declined, making the recovery less complete than a headline revenue increase suggests.
At June 28, cash plus short-term investments totaled USD 11.699 billion. Short-term borrowings plus long-term debt totaled USD 63.194 billion, implying USD 51.495 billion of net debt under this definition. At December 31 those figures were USD 13.596 billion and USD 64.795 billion, or USD 51.199 billion net debt. Gross borrowing fell while net debt rose slightly as liquid resources declined. The distinction matters: a debt-repayment announcement does not by itself establish greater financial flexibility.
The business has valuable distribution, development and manufacturing capabilities, but the balance sheet is not a source of exceptional strength. Substantial leverage reduces the room to protect dividends, acquire new assets and fund research simultaneously. Noncash impairment does not consume cash today, yet it signals that earlier expectations for acquired assets have weakened. Repeatedly ignoring both acquisition costs and subsequent impairments would overstate the economic quality of the franchise.
A reproducible operating sensitivity clarifies the bridge to valuation. Start with an illustrative USD 1.0 billion annual sales base for a replacement-product basket. If treated-patient volume grows 15% and net price declines 5%, revenue becomes 1.0 × 1.15 × 0.95 = USD 1.0925 billion. Incremental revenue is USD 92.5 million. At an assumed 40% incremental operating margin and 15% tax rate, incremental after-tax profit is USD 31.45 million. At an assumed 80% cash conversion, incremental FCF is USD 25.16 million. Across an illustrative 5.734 billion diluted shares, EPS rises about USD 0.0055; applying the base 11x multiple adds roughly USD 0.06 per share of earnings capitalized value. This is a sensitivity, not a product forecast or a DCF.
That modest result illustrates scale discipline. Several promising assets must become materially larger before they change group earnings. Conversely, a percentage point of net-price deterioration on a large established franchise can offset a small launch's entire contribution. The sensitivity's margin and cash assumptions must also absorb commercialization costs; assuming immediate mature-product profitability for every new indication would exaggerate the benefit.
The single most important variable is cash contribution from replacement products after lost exclusivity and launch spending. Cost savings can improve the transition, but savings that require continuing restructuring payments are not immediate distributable cash. Capital allocation should be judged by recurring FCF after maintaining the operating platform, not by how much adjusted EPS is protected in a single quarter. Our base judgment is improving operating resilience with still-incomplete financial repair.
4. Industry and Competitive Landscape
The relevant industry is global innovative pharmaceuticals, with competition determined inside disease categories and treatment lines. Total company sales do not provide a valid therapeutic market-share denominator. Patents, clinical differentiation, prescribing habits, reimbursement and supply capacity jointly determine returns. Competitive gains can take years to commercialize and then face abrupt erosion when exclusivity expires.
|
Competitive arena
|
Verifiable scale / position
|
Implication for Pfizer
|
|
Oncology
|
Merck Q3 KEYTRUDA / KEYTRUDA QLEX sales: USD 8.6 billion
|
Padcev and ELREXFIO must earn adoption against established treatment pathways
|
|
Immunology
|
AbbVie Q3 Skyrizi: USD 5.776 billion; Rinvoq: USD 2.706 billion
|
A demonstrated replacement-growth model; Pfizer has yet to show equivalent scale
|
|
Obesity and diabetes
|
Lilly Q3 Mounjaro: USD 10.723 billion; Zepbound: USD 5.352 billion
|
Pfizer pipeline optionality should not receive incumbent commercial economics
|
|
Mature medicines
|
Pfizer FY2026 expected generic / biosimilar revenue headwind: about USD 1.1 billion
|
Launch growth must first replace erosion before expanding the consolidated base
|
|
Company
|
Period
|
Revenue, USD billion
|
Growth
|
Profitability / accounting qualifier
|
|
Pfizer Inc.
|
Q2 2026
|
15.034
|
3% reported / 1% operational
|
Adjusted EPS 0.77; essentially flat YoY
|
|
Merck & Co., Inc.
|
Q3 2026
|
18.085
|
5% reported / 4% ex-FX
|
Non-GAAP EPS 2.49; down 3%
|
|
AbbVie Inc.
|
Q3 2026
|
17.404
|
10.3% reported / 10.5% operational
|
Adjusted EPS 3.82; includes USD 0.11 IPR&D impact
|
|
Eli Lilly and Company
|
Q3 2026
|
24.397
|
39% reported
|
Non-GAAP EPS 7.48; includes USD 4.57 acquired IPR&D
|
Peer periods differ because Pfizer's Q3 release is still pending at this research cutoff; the table compares Pfizer Q2 with peers' published Q3 results. Growth is year over year within each issuer's own period. Adjusted EPS definitions differ, particularly the treatment of acquired IPR&D, so absolute EPS and profit growth are not interchangeable measures of operating superiority. We do not construct a peer P/E ranking without synchronized prices and normalized earnings.
Lilly is the clear growth winner in this group, supported by its diabetes and obesity franchises. AbbVie is winning in replacement execution, with Skyrizi and Rinvoq illustrating how newer products can offset a major mature franchise. Merck retains exceptional oncology scale, although concentration and future replacement needs remain relevant. Pfizer is a selective commercial winner in products such as Padcev, but currently loses the comparison on consolidated growth and breadth of replacement evidence. This is a relative commercial assessment, not a forecast of share-price performance.
Pfizer is a net beneficiary of broader demand for innovative oncology and specialty medicines, yet a net laggard in capturing the sector's fastest growth. Its opportunity is to improve earnings durability enough that a low multiple becomes excessive. The strongest competing explanation is that the discount correctly reflects a prolonged replacement cycle and restricted cash flexibility. Our cautiously positive view requires better cash evidence to defeat that explanation.
For monitoring, market share should be assessed using the same indication, geography, treatment line and period. A product can gain patients while losing net revenue through payer concessions. A combination regimen can also increase medical adoption without giving each partner equal economics. These distinctions are particularly relevant when comparing alliance revenues with peers that record a different portion of the commercial value chain.
5. Key Risks
-
Replacement shortfall: If launched/acquired product growth falls below 10% for successive quarters, the newer portfolio may fail to outrun mature-product erosion. Revenue stagnation would then feed through fixed commercial and research costs into weaker earnings and a lower defensible multiple.
-
Cash payout pressure: If trailing-year FCF remains below cash dividends, maintaining distributions competes directly with debt reduction and pipeline investment. A high quoted yield would then reflect financing pressure rather than a securely funded return.
-
Net-price compression: Greater rebates, reimbursement restrictions or generic entry can offset prescription growth. The warning signal is growing volume with falling product revenue or declining gross margin, which weakens the modeled operating leverage.
-
Clinical or regulatory disappointment: A failed pivotal study, restrictive label or delayed submission reduces the probability and timing of future sales. ELREXFIO's encouraging PFS headline cannot eliminate immature survival data, safety considerations or regulatory uncertainty.
-
Acquisition economics: Additional impairment or repeated large licensing commitments without subsequent commercial contribution would weaken confidence in capital allocation. Cash commitments may precede launch receipts by years while adjusted reporting smooths the apparent earnings impact.
-
Seasonality and channel timing: COVID and vaccine purchasing, returns and wholesaler inventory can move quarterly revenue without changing recurring demand. Extrapolating a seasonal quarter can distort both cash expectations and valuation.
-
Instrument basis and issuer structure: PFEON is a tokenized exposure, with custody, issuer, liquidity and redemption terms that differ from directly holding NYSE common shares. Token trading performance and any treatment of distributions must be evaluated separately from this underlying-company earnings analysis.
6. Monitoring Checklist
The following thresholds are research decision rules, not management guidance.
-
November 3 Q3 release and call: Compare revenue with the USD 15.85–16.13 billion secondary-consensus band and adjusted EPS with USD 0.72–0.73; prioritize guidance and cash explanations over a small quarterly beat.
-
Non-COVID operational growth: Sustained growth of at least 5% strengthens the base case; a decline below 3% weakens the replacement thesis even if foreign exchange supports reported sales.
-
Launched/acquired products: Growth above 15% supports increasing relevance; below 10% for two quarters calls for a lower sustainable earnings assumption.
-
Dividend coverage: Seek trailing-year FCF / cash dividends above 1.0x, preferably 1.2x. Continued sub-1.0x coverage weakens the income-based valuation argument.
-
Net debt: Require a decline from the June USD 51.495 billion baseline using the same cash and borrowing definitions. Gross debt reduction funded by liquid-asset depletion does not satisfy this test.
-
ELREXFIO evidence and submissions: Track detailed PFS and safety data, survival maturity and filing milestones. Clear regulatory progress strengthens optionality; material delay reduces its value.
-
2026 guidance and spending: Holding or raising the USD 2.80–3.00 adjusted EPS range while sustaining research and funding the dividend supports resilience. A cut combined with another cash-intensive transaction would warrant a more negative judgment.
Data boundary: This report is dated November 3 in Asia/Shanghai and is a pre-release assessment using Q2 financials and subsequent public announcements. It does not include unannounced Q3 results. The October 30 equity close is used consistently because retrieved November 2 pages show inconsistent times and prices. A later stock price changes the quoted yield and multiple mechanically; it does not repair the cash-coverage gap. LBank pages verify a populated interface and company mapping, not an executable live quote or the availability of every account's trading permissions.
7. Sources



 Transfer